Global Socioeconomic Data and Digital Boundaries from Michael Bauer International GmbH
Purchasing Power describes the disposable income (income without taxes and social security contributions, including received transfer payments) of a certain area’s population.
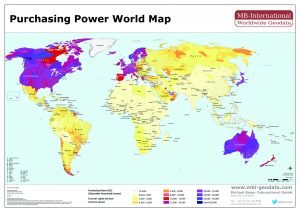
Purchasing Power – The key indicator for sound location and sales territory planning
In today’s competitive retail market, sales, optimization and growth are critical to survival. All businesses need to know where their customers are located and how much disposable income their target groups possess. Basically the understanding of what the population in a given area has available for consumption. The Purchasing Power allows companies to zero in on their regional markets with increased precision and accuracy.
Companies from across all branches use Purchasing Power to determine market strengths, weaknesses, optimize product and/or sales networks, map marketing campaigns and develop expansion strategies. Using the digital postcode or administrative boundary maps for the geographic visualization of the purchasing power allows for an even more effective and efficient decision-making.
The data bundle “Sociodemographics” classifies the regions in regard to the following basic information:
- Population
- Households
- 15-year Agebands: 0-14, 15-29, 30-44, 45-59, 60+
- Sex / Gender
- Unemployment (on admin levels)
The information is relevant as the business plans for the future. The interrelationship between population demographics, business climate, housing, and the physical structure of communities provides guidance on funding priorities and relative need.
Their power can be used to improve consumer targeting, to understand market opportunities and to quantify the consumers’ potential demand for European countries.
Consumer Spending by Product Groups quantifies the expenditures of consumers on certain groups of goods.
Consumer Spending by Product Groups
- Food and non-alcoholic beverages
- Alcoholic beverages
- Tobacco
- Clothing
- Footwear
- Furniture and furnishings, carpets and other floor coverings
- Household textiles
- Household appliances
- Glassware, tableware and household utensils
- Tools and equipment for house and garden
- Routine household maintenance
- Medical products, appliances and equipment
| - Consumer Electronics, photographic and IT equipment
- Durables for recreation and culture
- Toys and games, hobby, sport, garden, pets
- Recreational and cultural services
- Newspapers, books and stationery
- Catering Services
- Personal care
- Jewellery, clocks, watches and other personal effects
|
On request additional specifications and subdivisions can be calculated.
Retail Spending relates to the proportion of Purchasing Power of a certain area’s population that is available for spending in retail. General Purchasing Power less expenditures for rents, mortgage interests, insurance, motor vehicles, for travels or services refers to the potential expenditure in retail at the consumers’ place of residence.
Retail Turnover
Retail Turnover measures the turnover of local retail trade. In contrast to the Purchasing Power and Retail Spending, Retail Turnover quantifies the purchases at the consumers’ place of expenditure.
Retail Centrality
Retail Centrality Index describes the ability of an area to pin the Retail Spending of its population and of other areas’ population down to the local retail trade. Cities having a large shopping appeal show a Centrality Index of more than 100, because they tie more Retail Spending of surrounding areas to themselves than they emit to those areas.
For more information contact:
Erik van Hunnik (email)
+ 31 6 50276604 / + 31 15 2190885